University of Twente
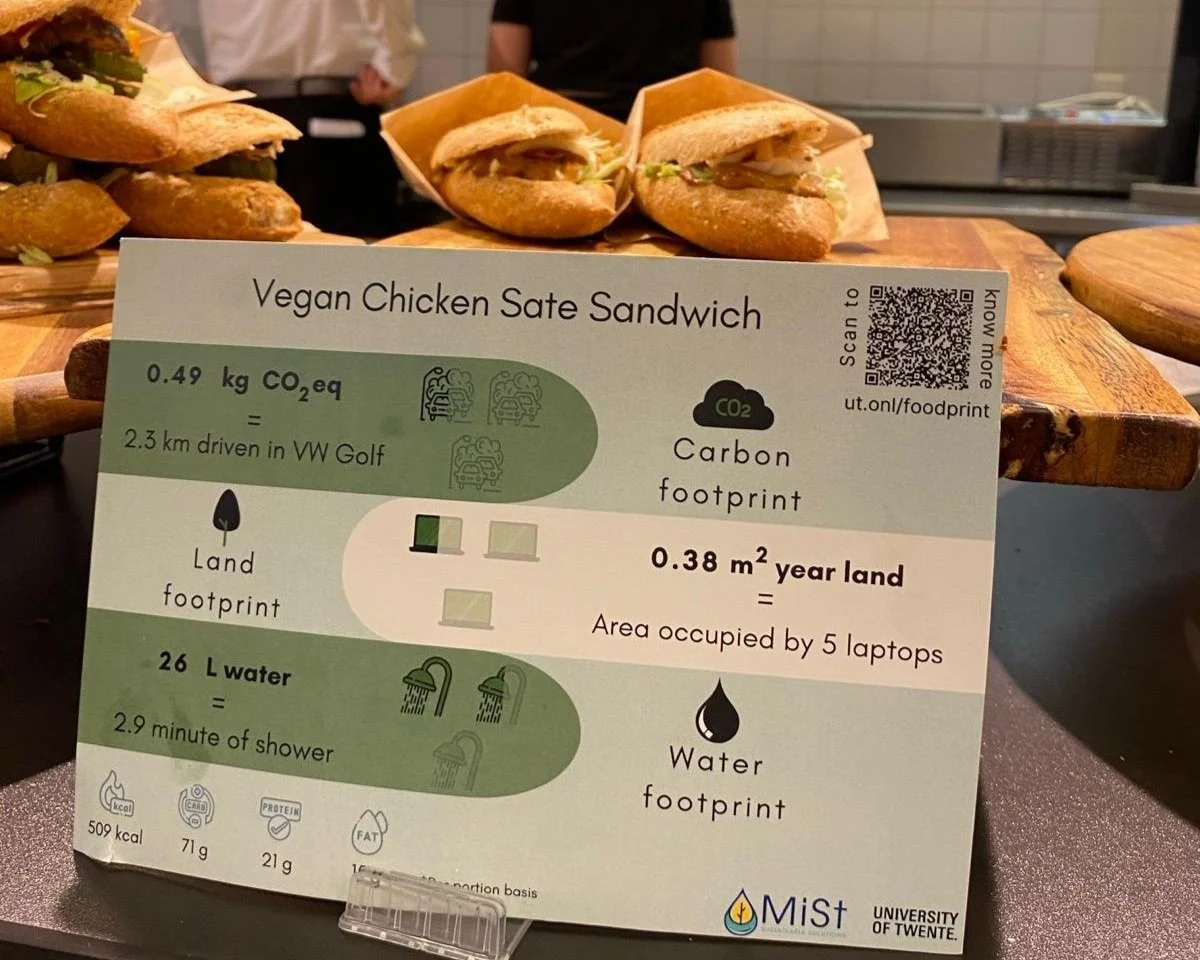
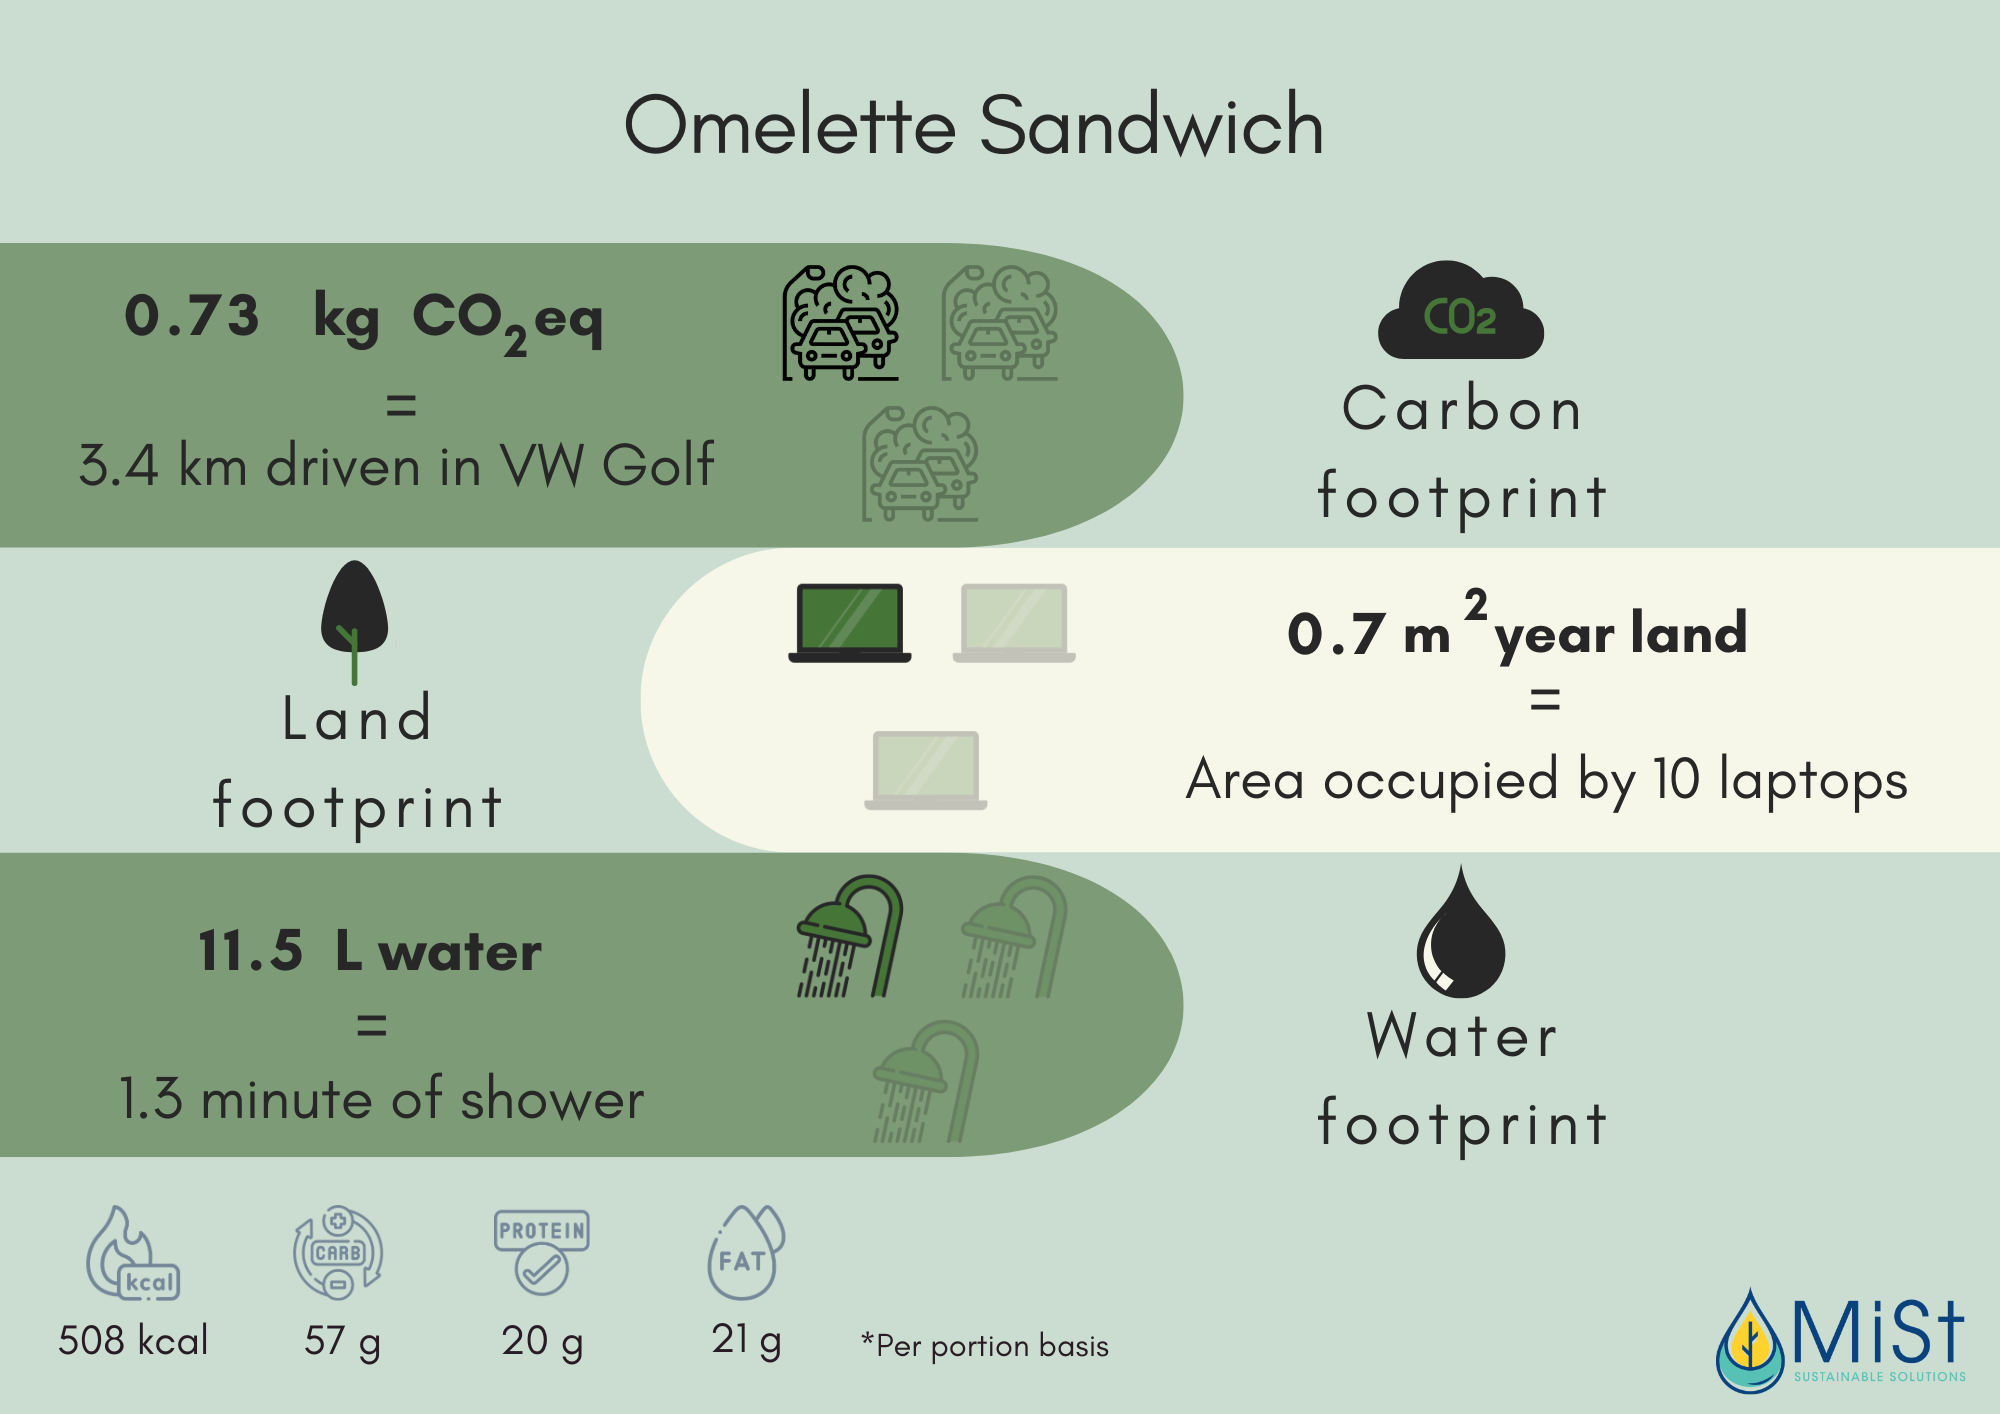
Footprint labels for every sandwich in the UT canteens, right at the point of purchase.
1 in 0
changed
their choice
their choice
0%
wanted
full rollout
full rollout
We analyse every dish on your canteen menu and display its CO₂, water and land footprint right next to the food — in terms anyone can understand, without telling anyone what to eat.
of participants want to reduce their environmental footprint through food
people changed their food choice after seeing the footprint visualisation
wanted the labels extended to every dish served in the canteen
We analyse every ingredient in every dish using a database of over 400+ base ingredients built on Life Cycle Assessment methodology. The result is a precise footprint for each item, displayed next to the food clearly and honestly.
No app required. No QR codes. No lecture. Just the right information at the moment it matters.
We do the heavy lifting. You get print-ready labels in days, not months. The effort on your side is a single spreadsheet.
Send us your ingredient list and quantities. No special format — a simple spreadsheet is all we need.
We calculate CO₂, water and land footprints using our 400+ base ingredient LCA database.
We deliver branded draft visualisations. You give feedback and we refine until everything is right.
Print-ready files land in your inbox. Place them and watch sustainable choices increase.
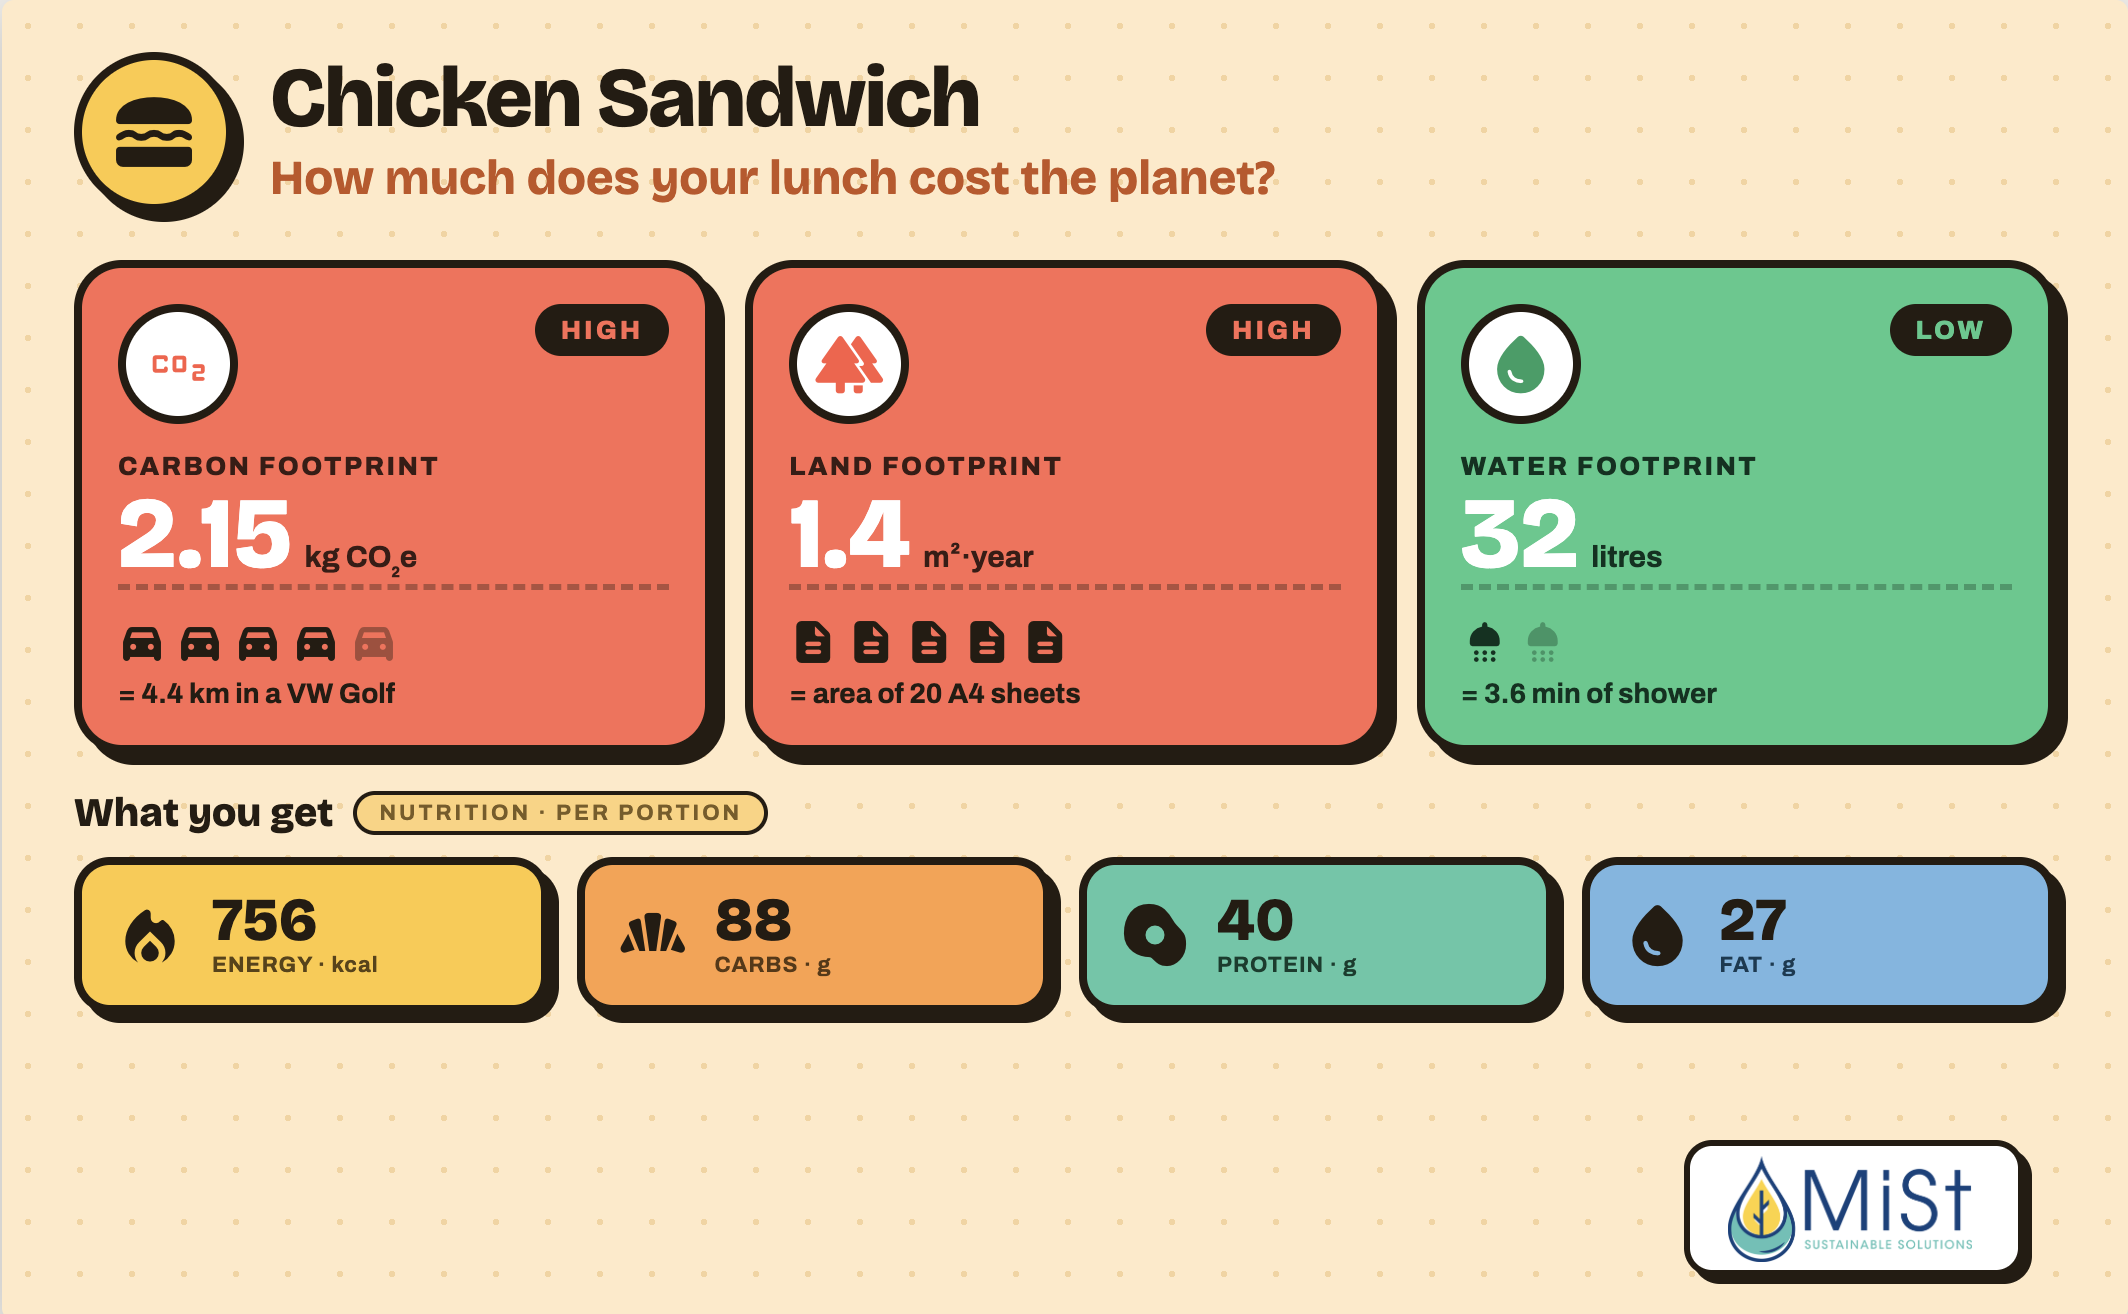
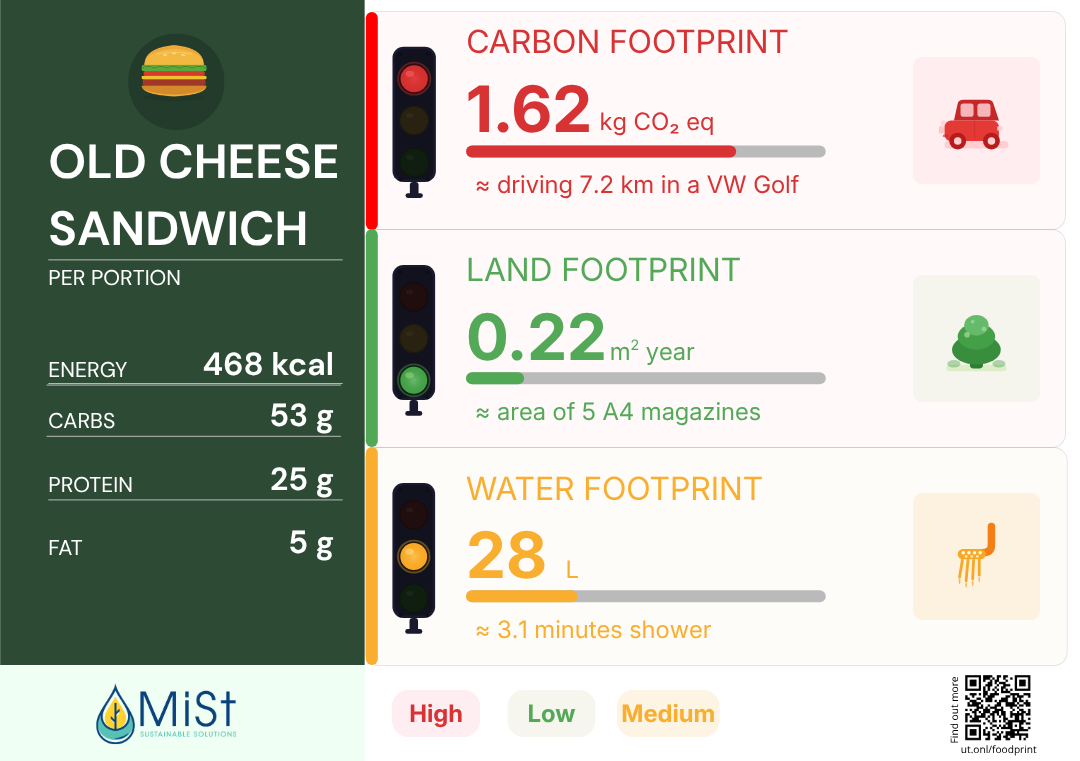
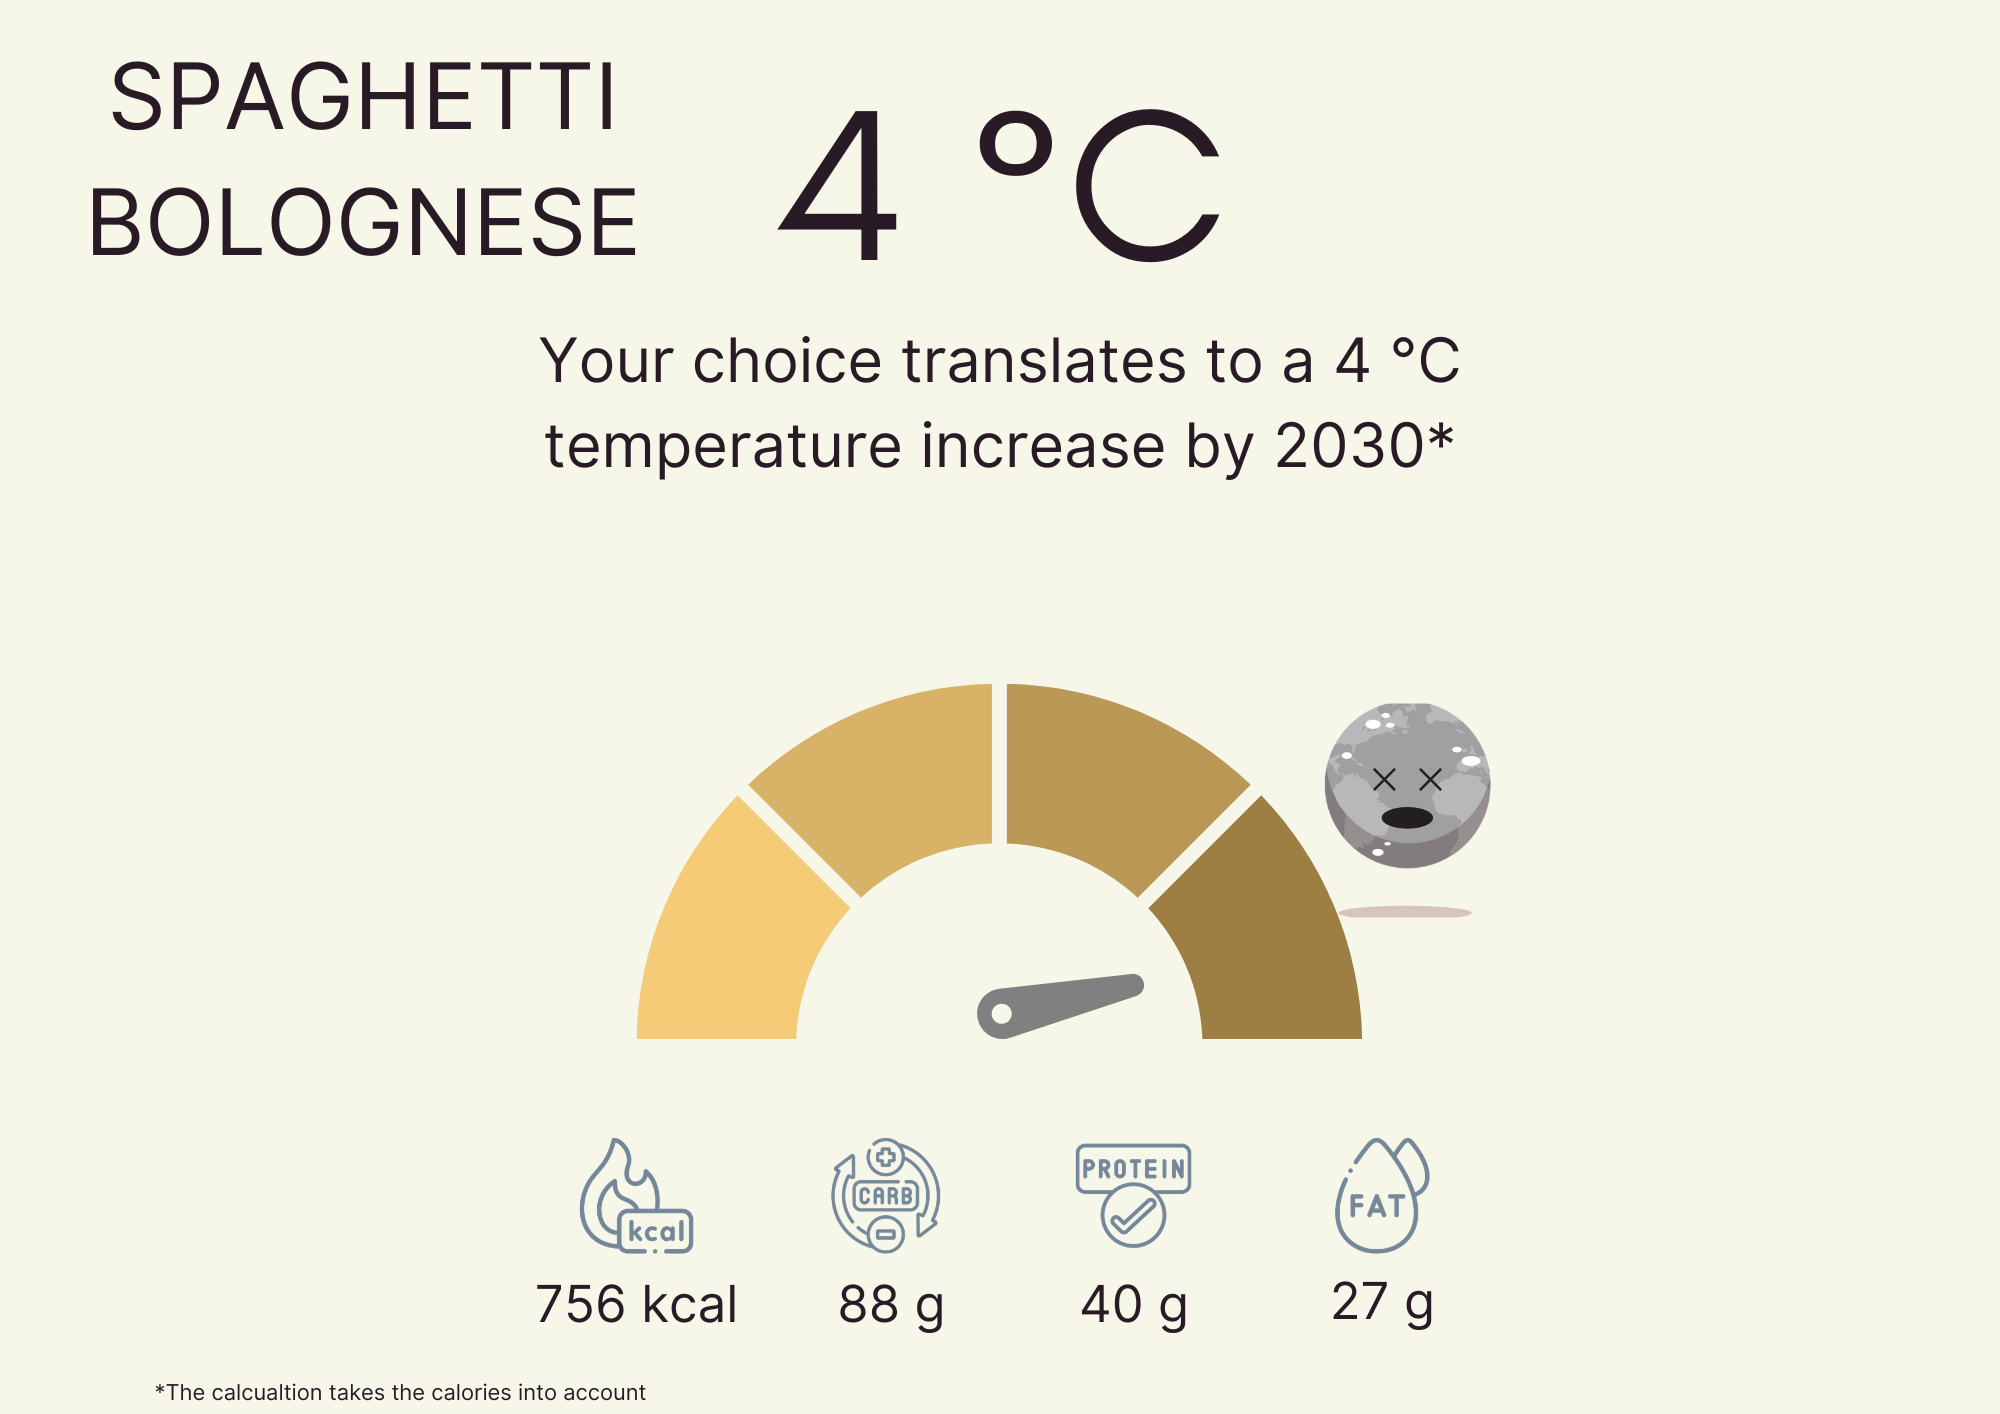
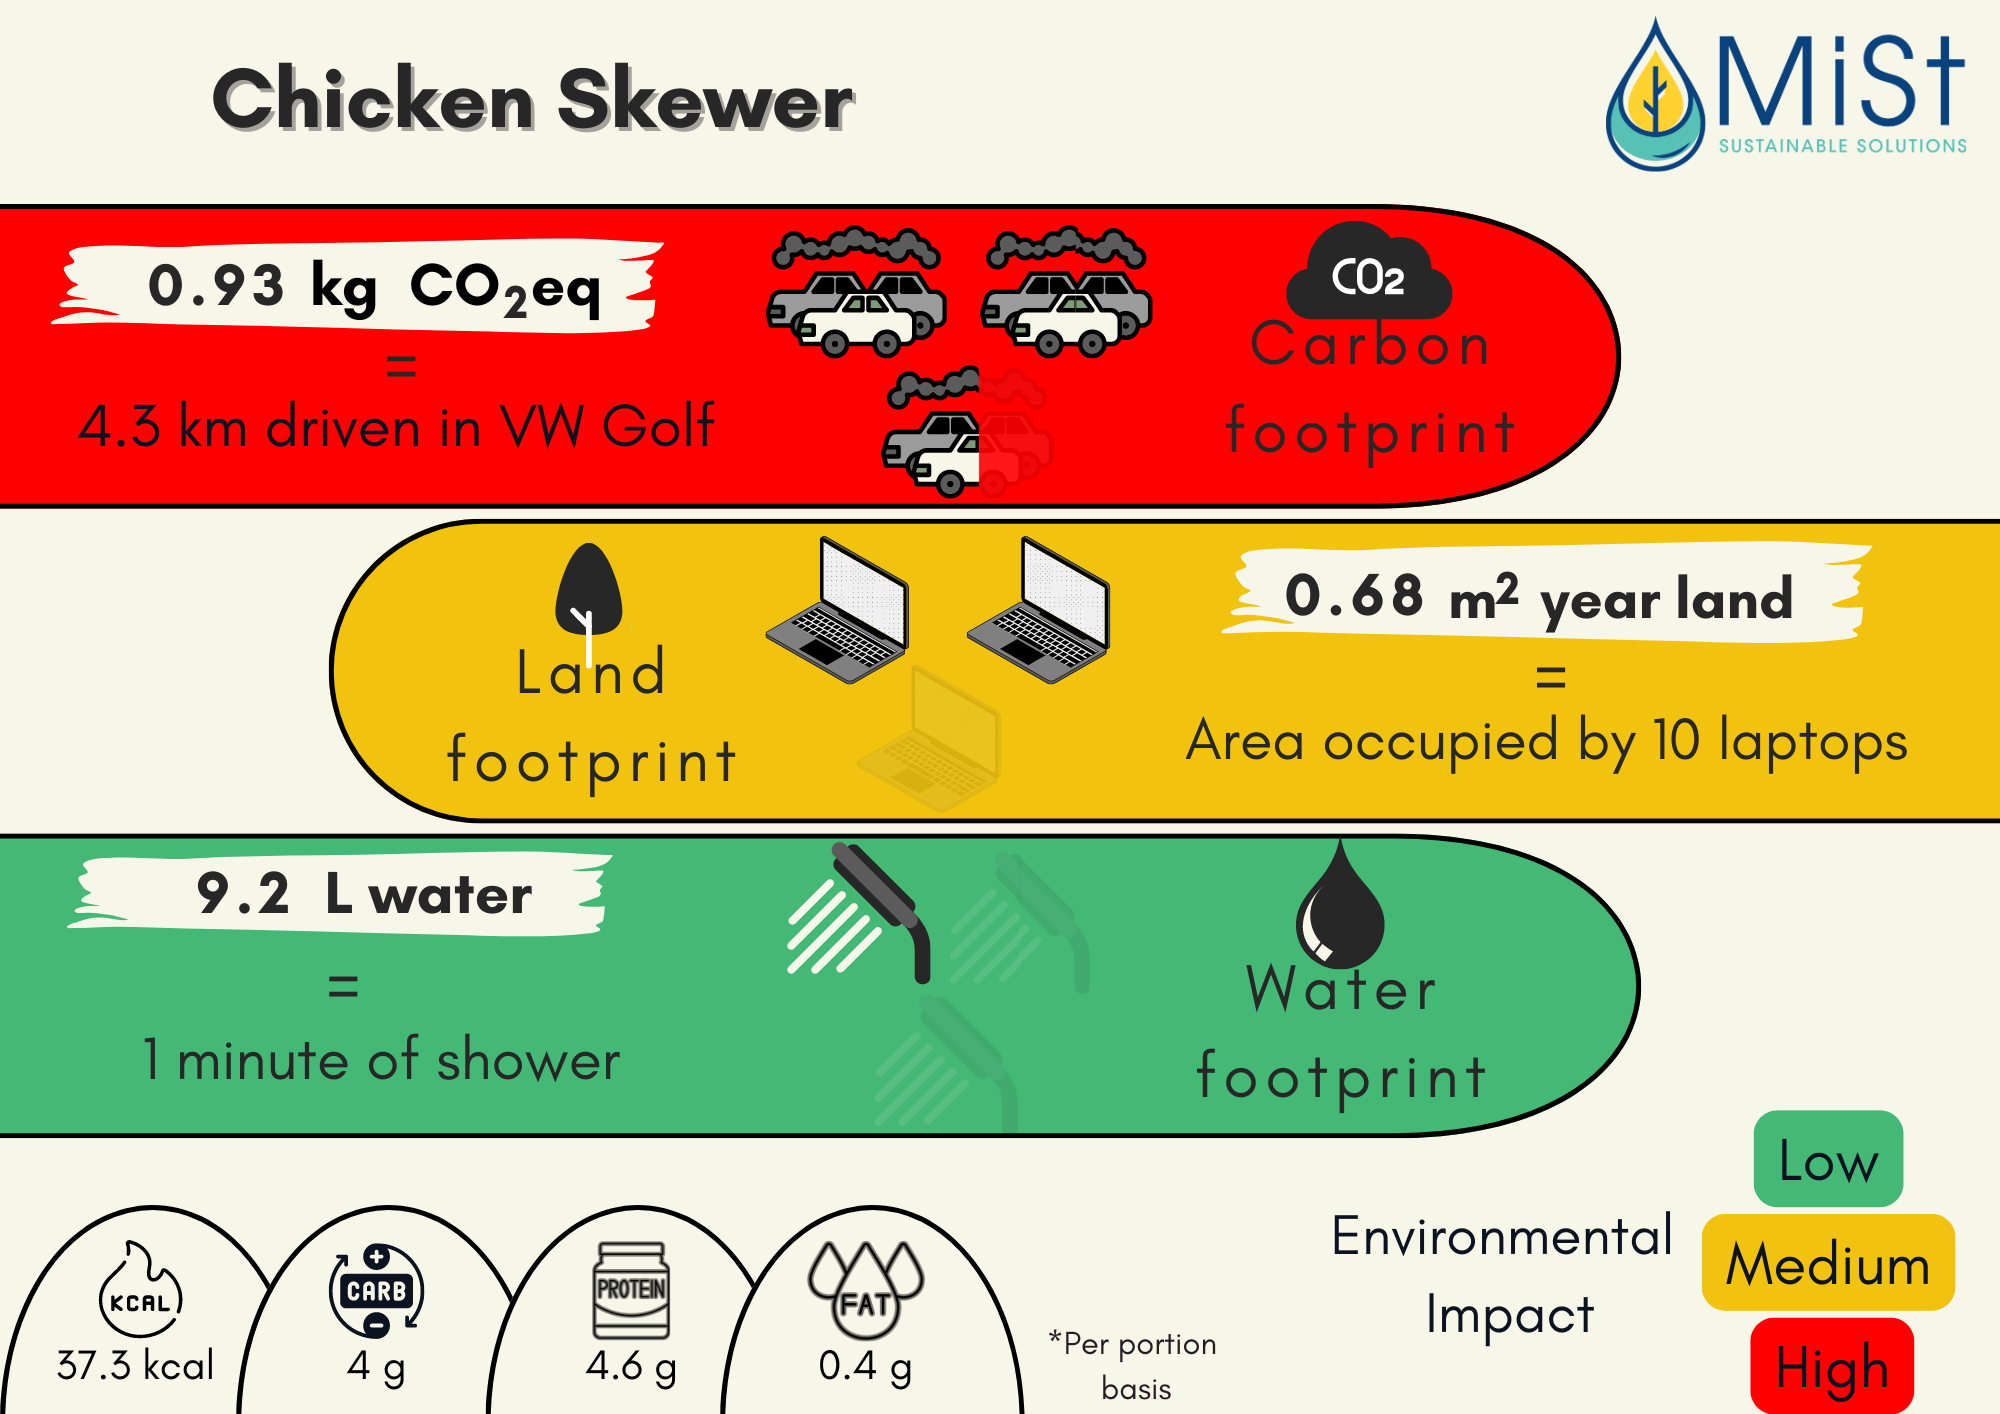
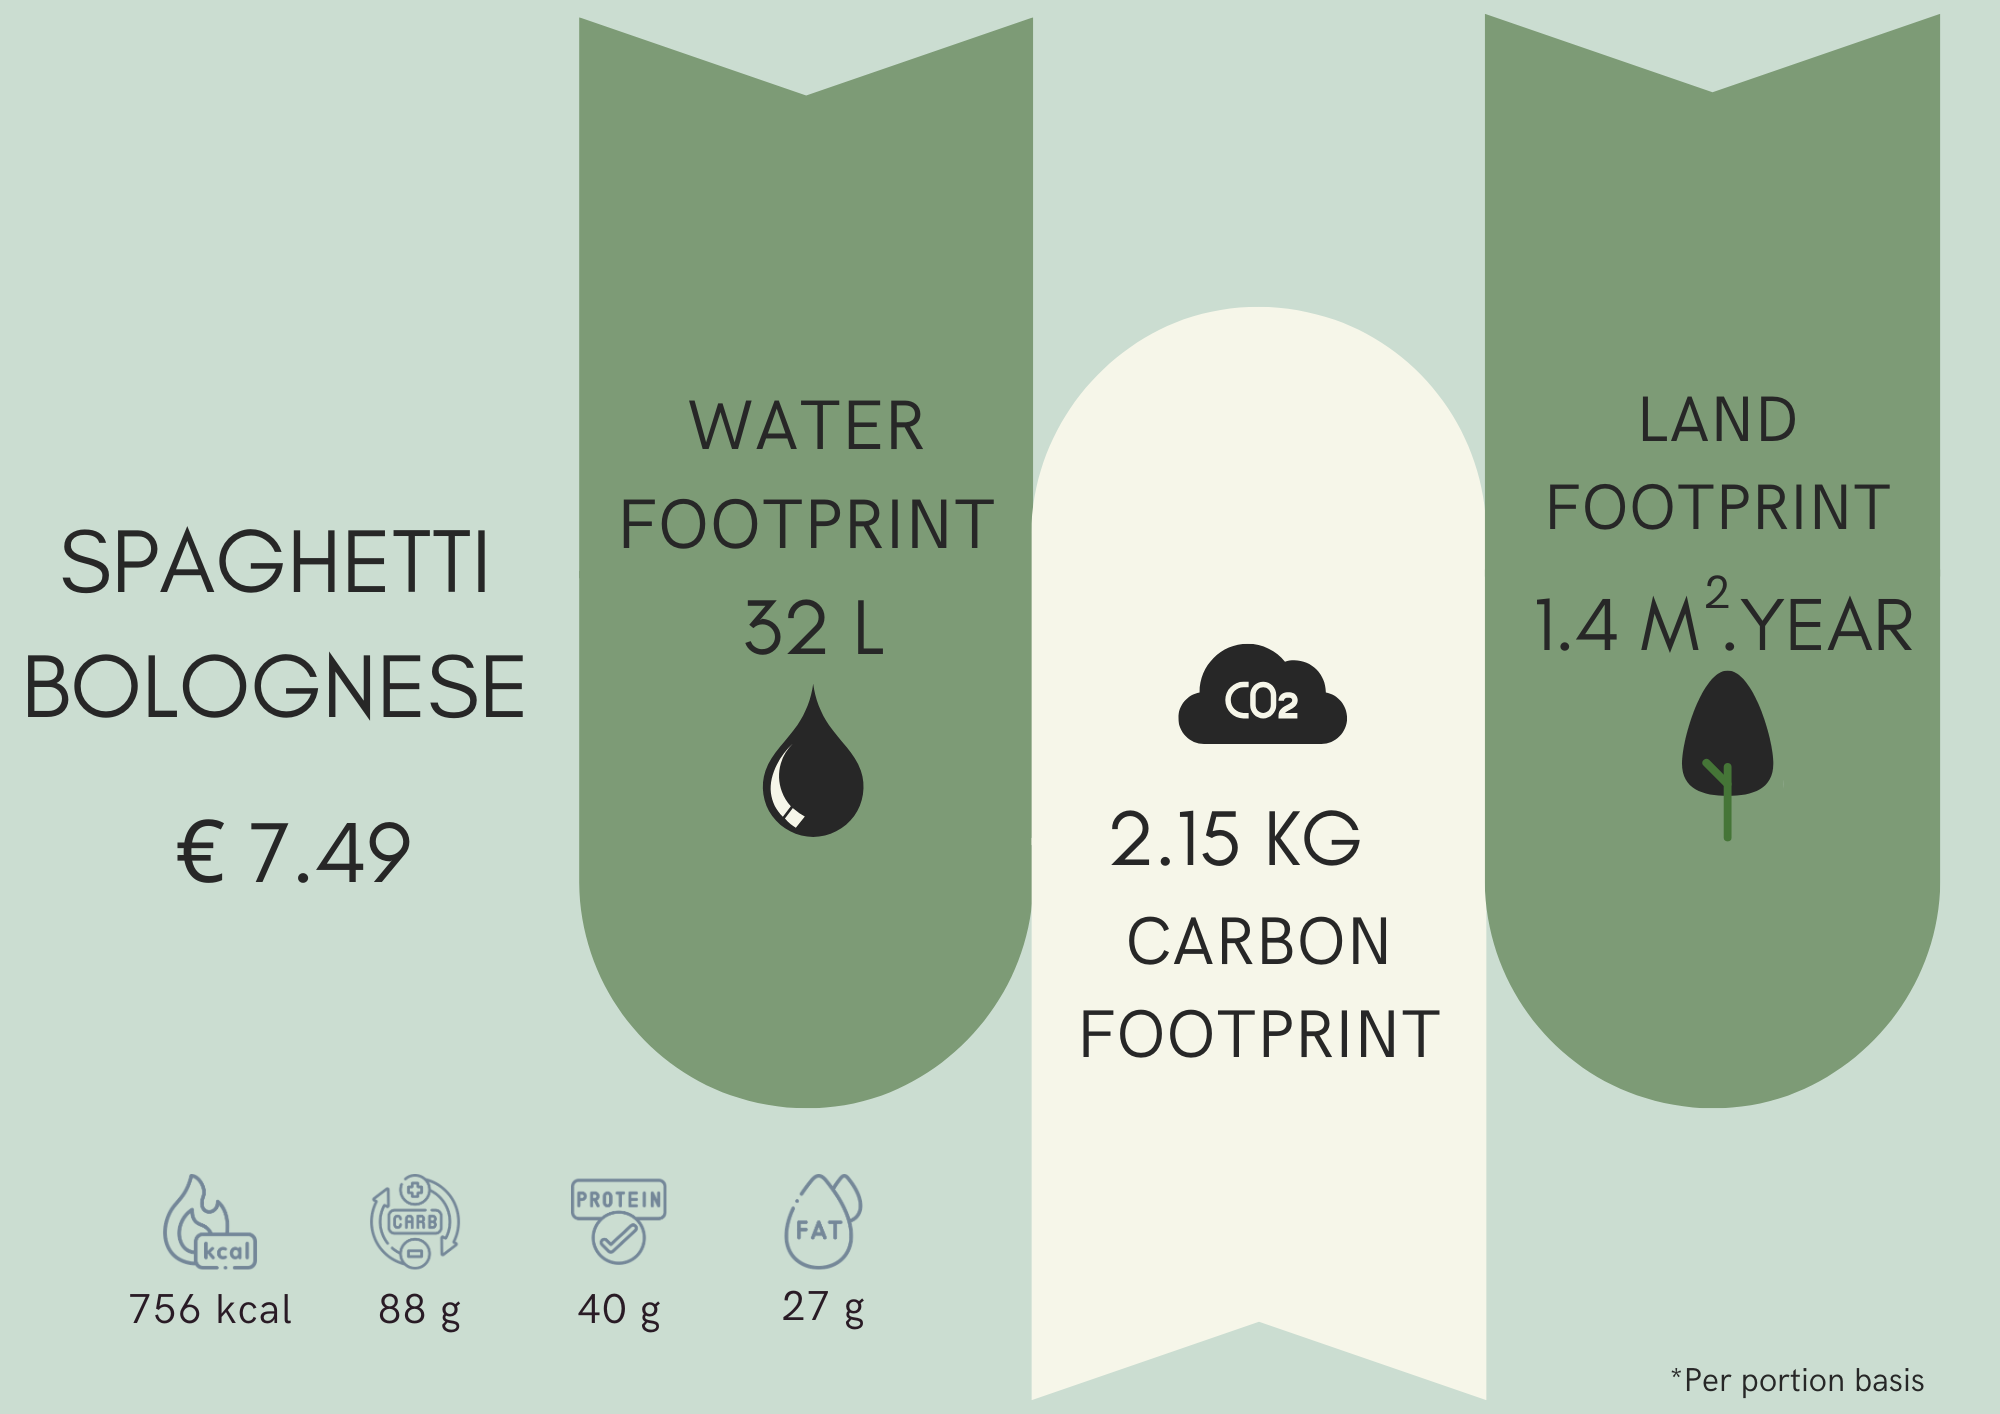
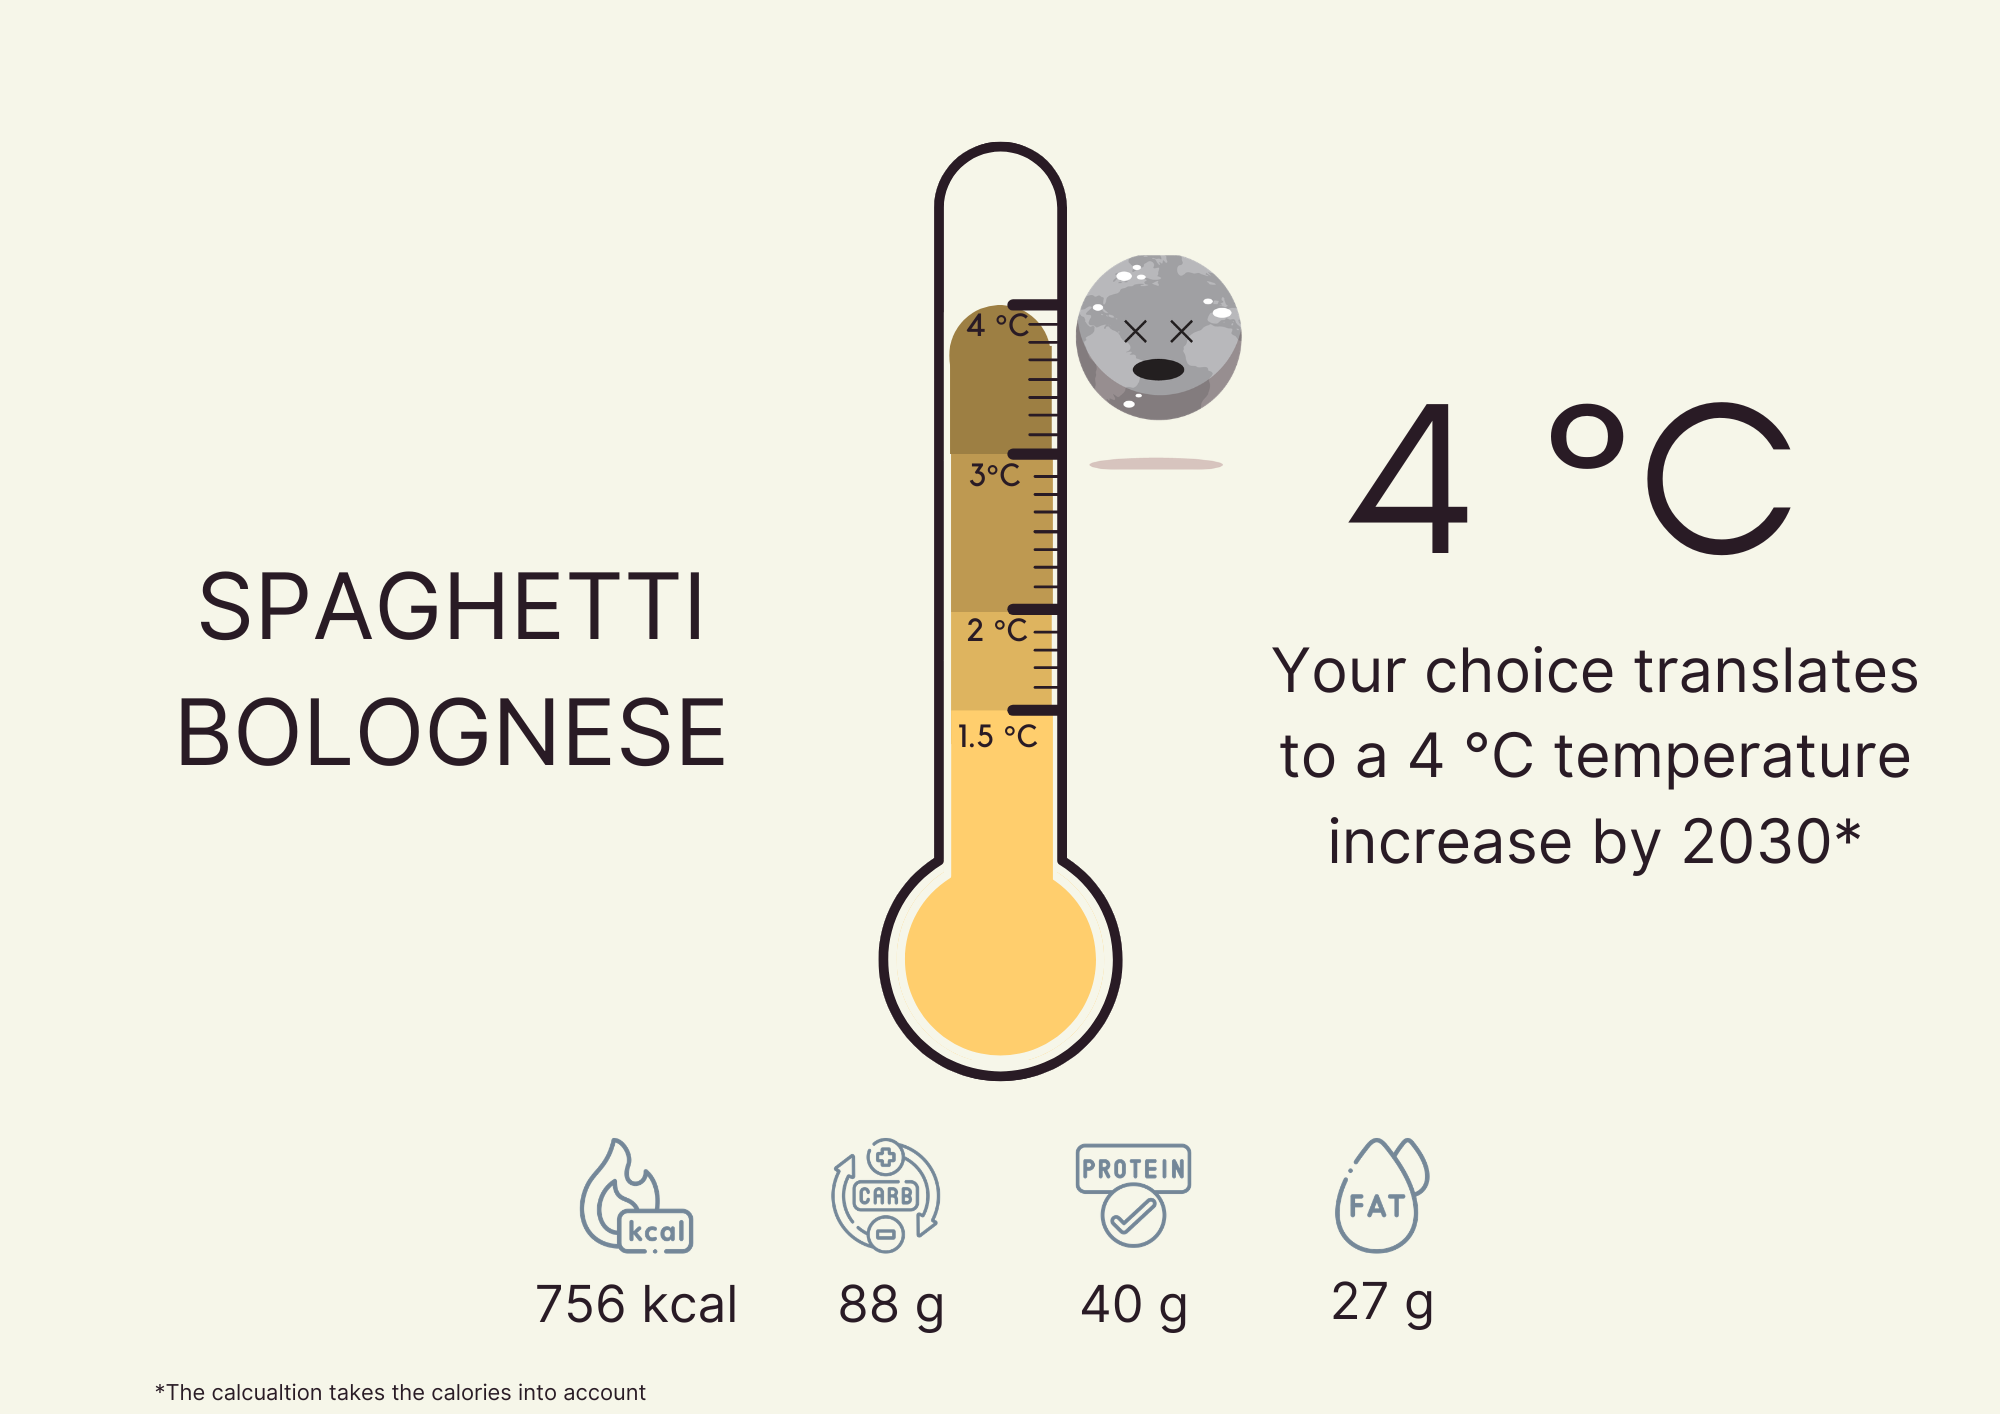
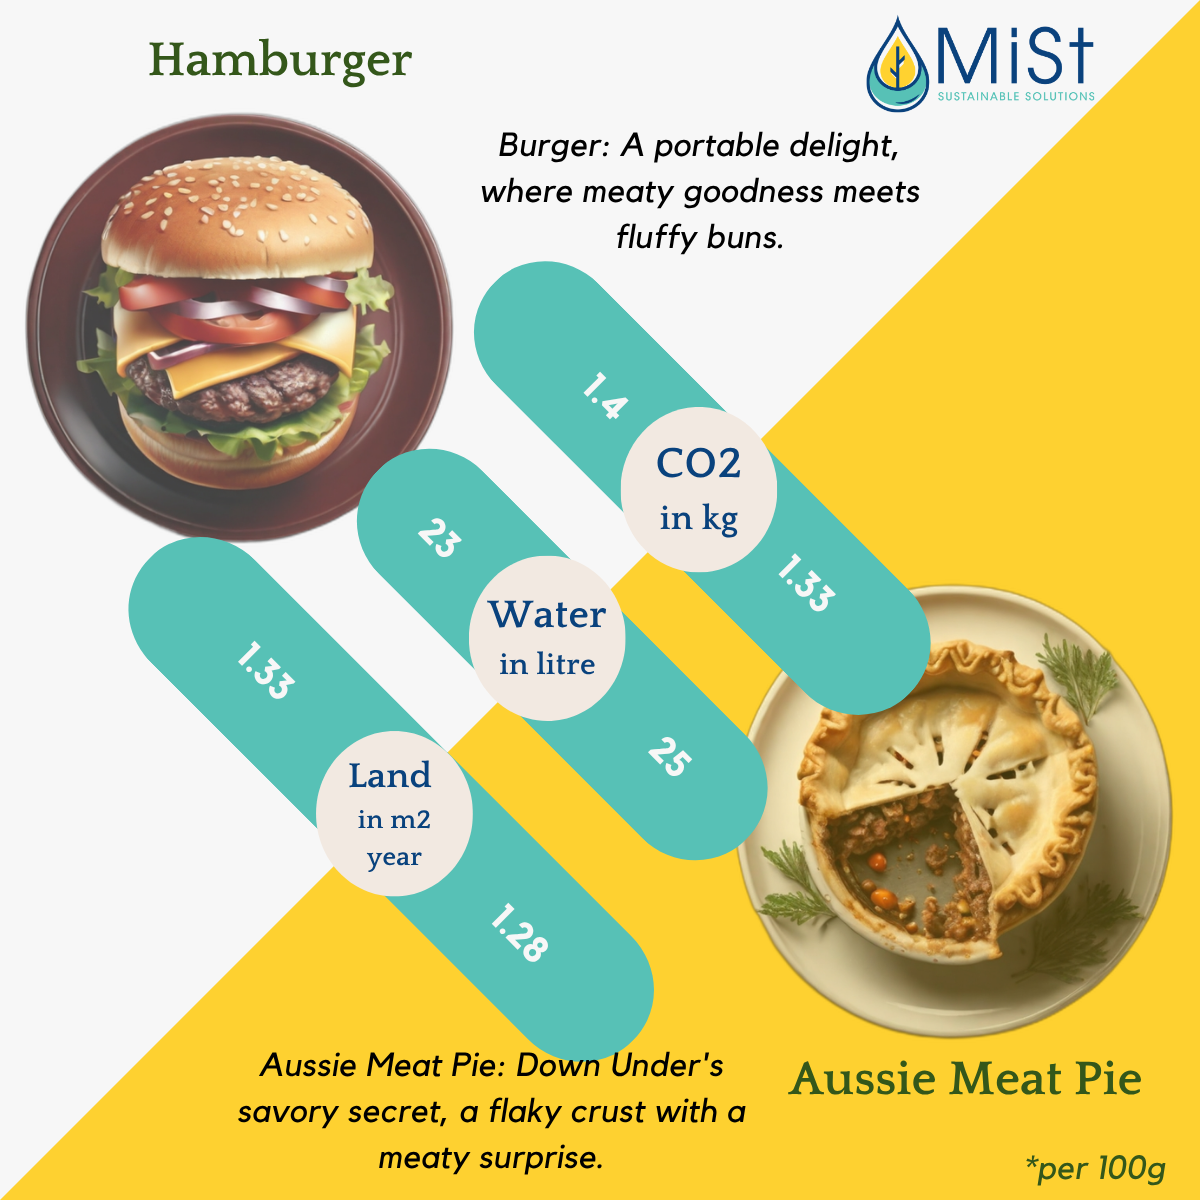
From single-dish labels to whole-menu overviews and custom visualisations — every format turns an ingredient footprint into something anyone can read at a glance. Here's a look at the range we've built.
 Click to enlarge
 Click to enlarge
 Click to enlarge
 Click to enlarge
 Click to enlarge
 Click to enlarge
 Click to enlarge
 Click to enlarge
 Click to enlarge
Real pilots, real canteens, real behaviour change — here's what happened when footprint labels met the point of choice.
Footprint labels for every sandwich in the UT canteens, right at the point of purchase.
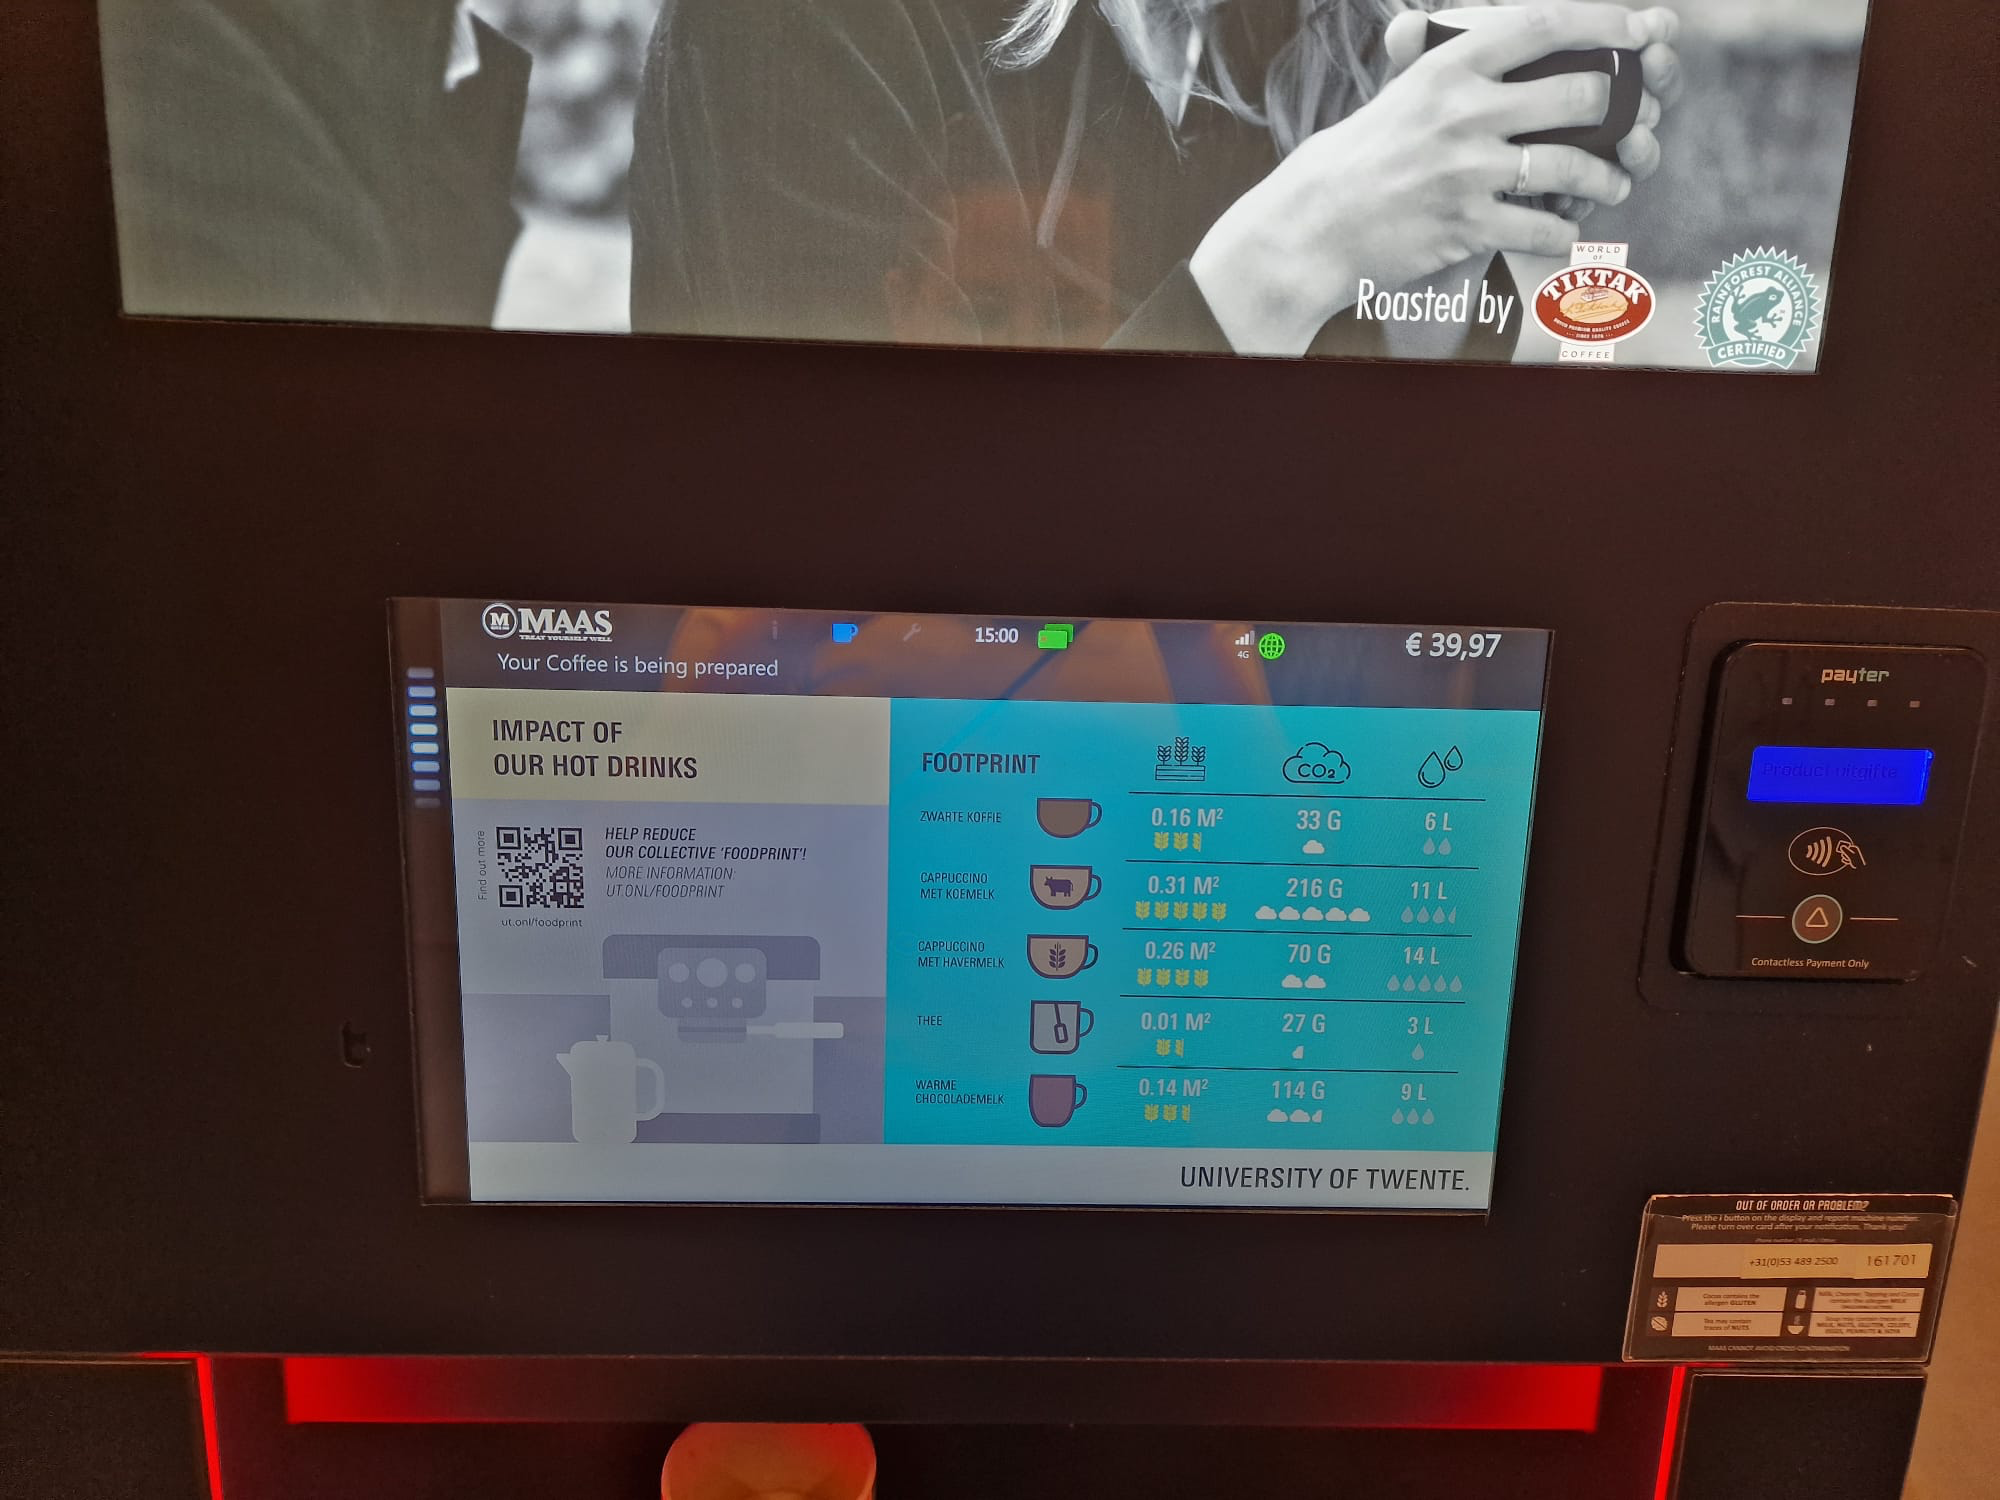
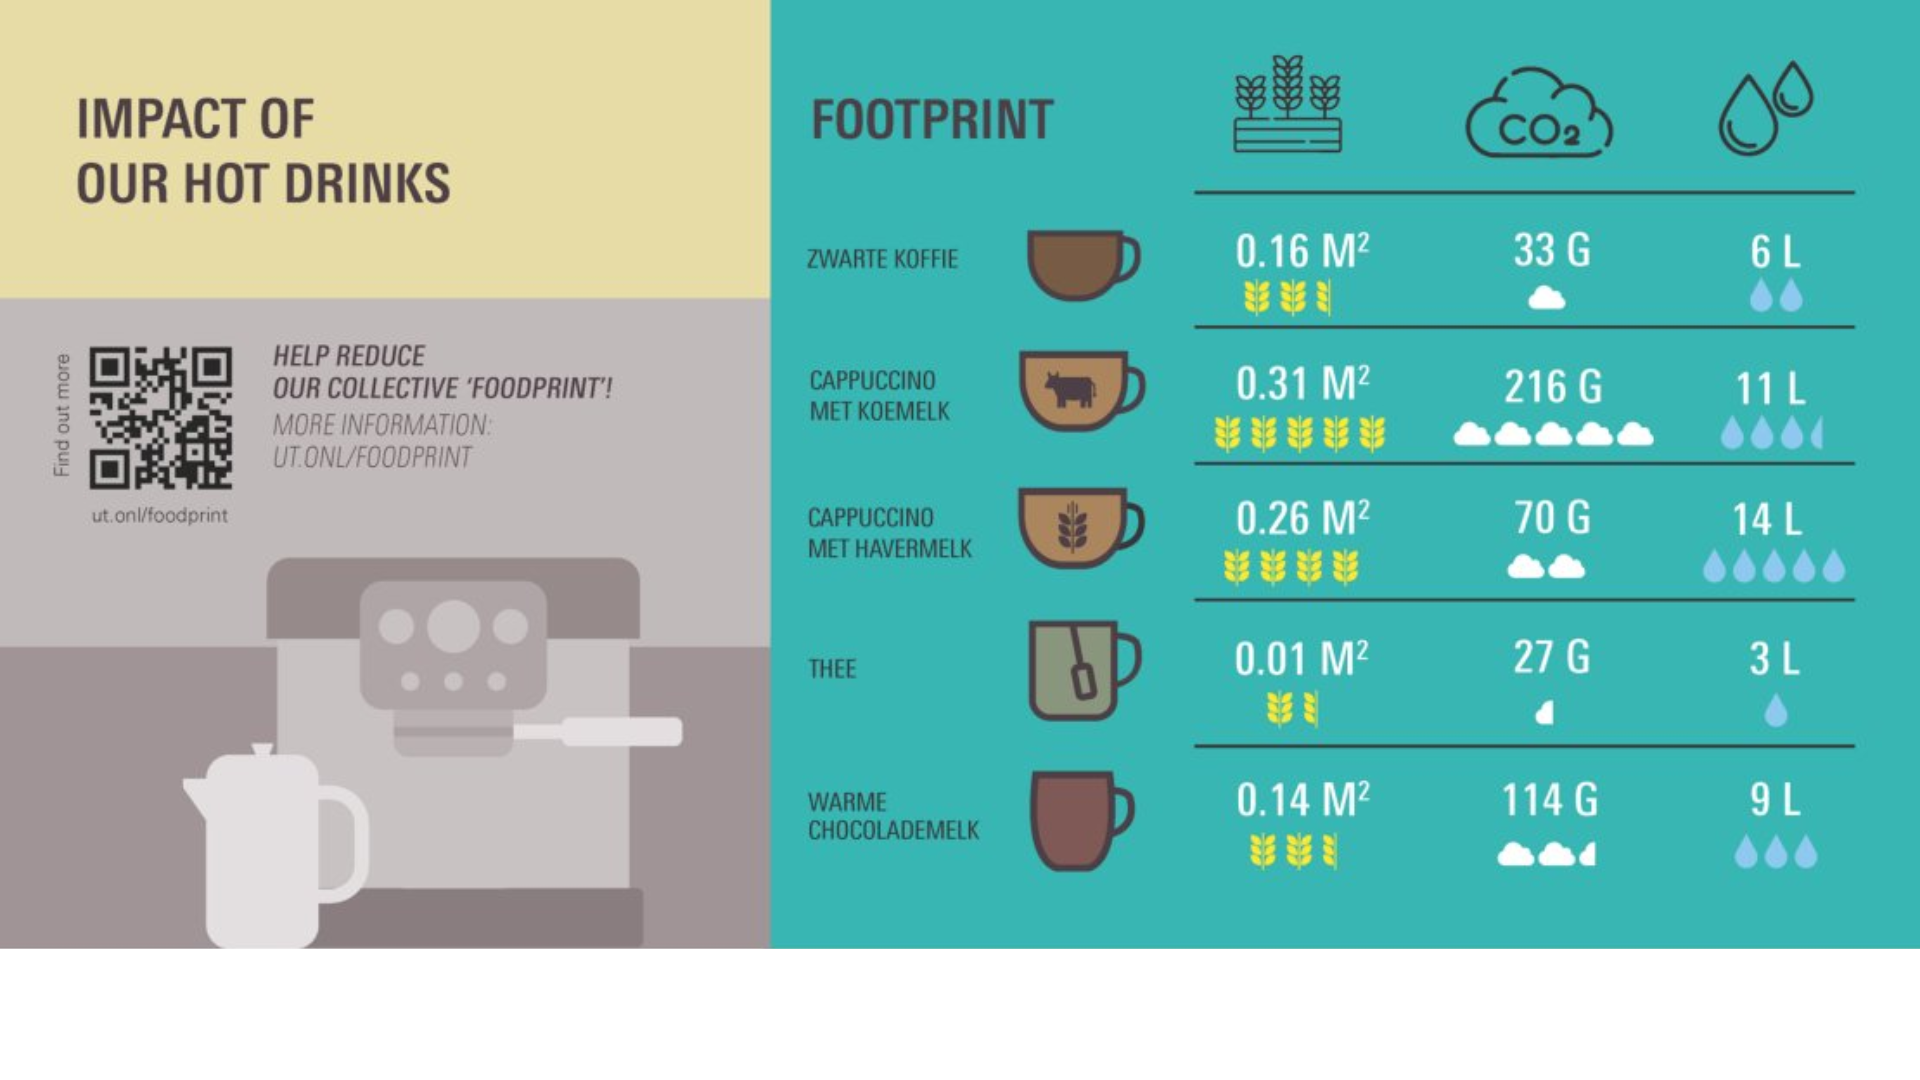
CO2, water and land footprint of every hot drink, shown on the machine screen before you press the button.
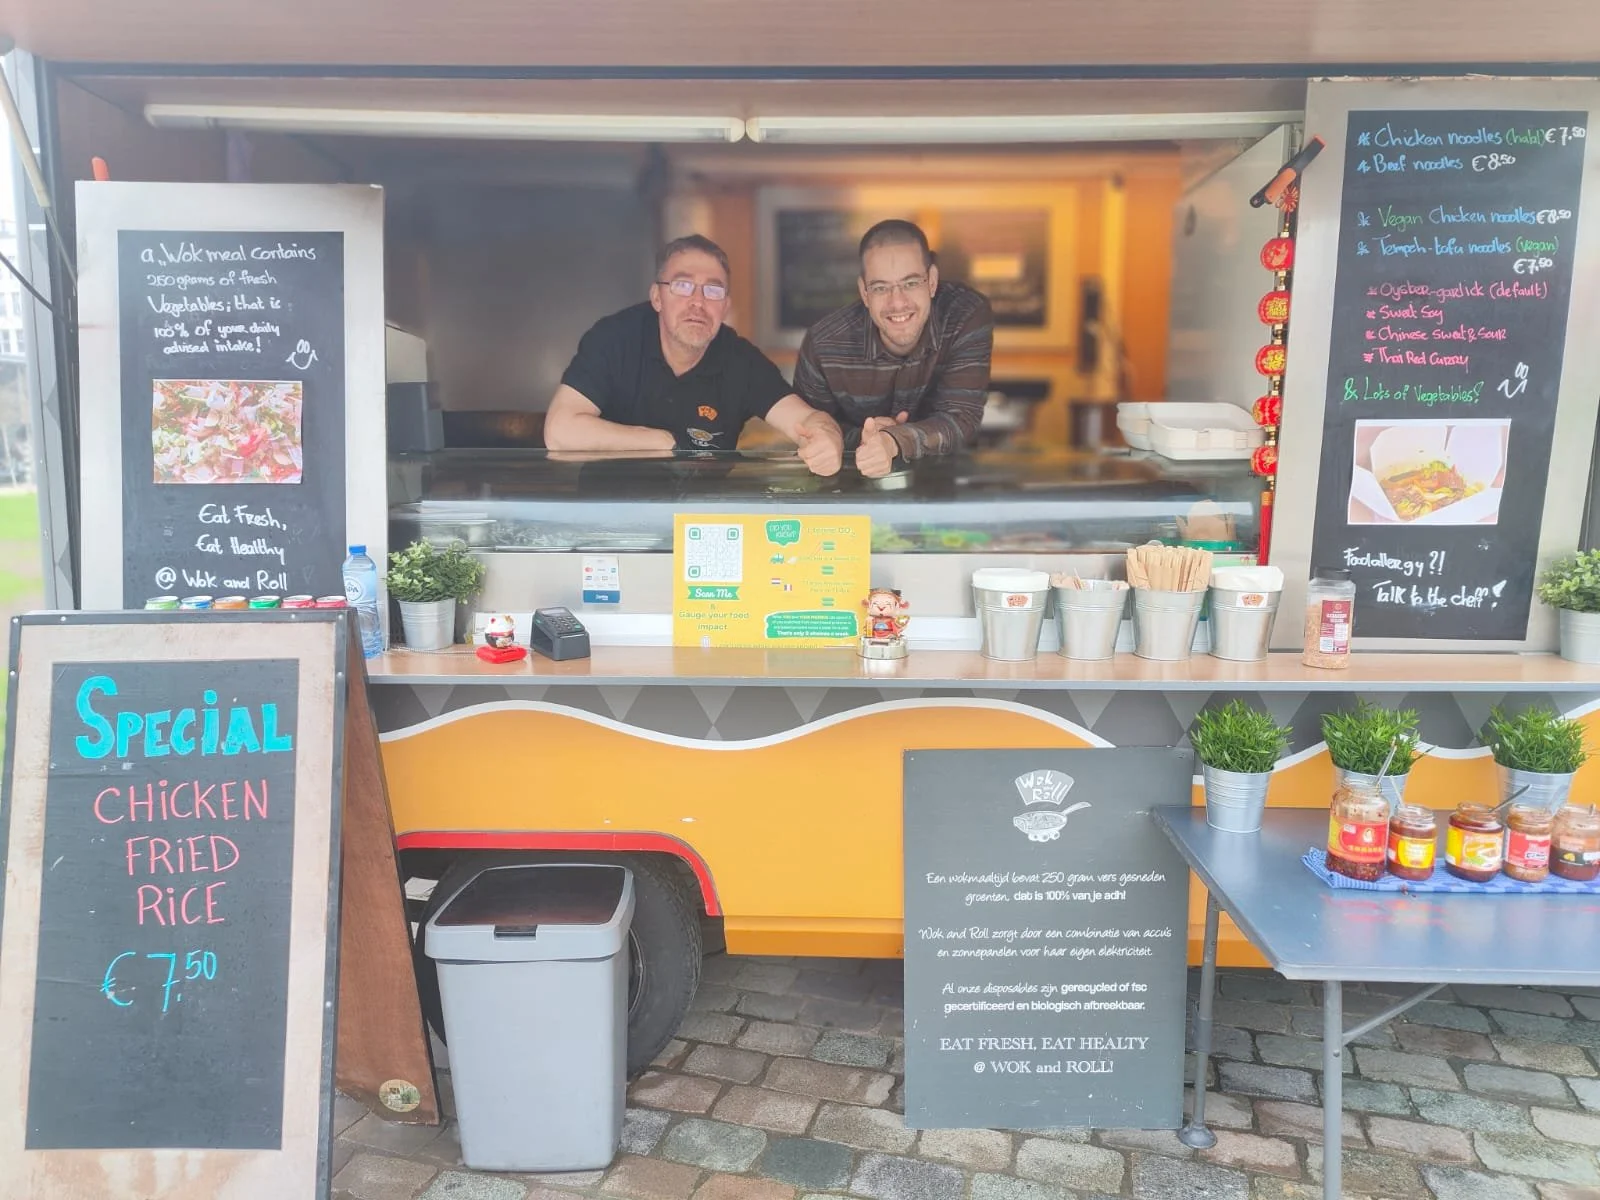
Digital footprint visualisations with stamp cards, capturing real engagement at the point of sale.
Share your menu and ingredient list and we will have draft visualisations ready for you to review. The whole process takes days, not months.